North-South Corridor Study
OVERVIEW
The North-South Corridor Study is part of the Central Maryland Regional Transit Plan (RTP), a 25-year plan for improving public transportation in Central Maryland. MTA, in partnership with Baltimore City and Baltimore County, has identified the range of options (also known as Alternatives) that best serve existing and future transit demand between the Towson area of Baltimore County and downtown Baltimore. Click here to learn more about the overall Corridor Study process, including information about why this corridor study area was identified as a top priority by the RTP Commission.
The conclusions of the North-South Corridor Feasibility Study will serve as the basis of the preliminary alternatives that will be studied in detail during the Alternative Analysis (AA) phase. In 2024, the project team will present the preliminary alternatives that will continue into the AA phase and share the public engagement plan for stakeholder and public feedback during this phase of the project. The AA phase is expected to take approximately two years to complete, depending on the number and complexity of alternatives included for study. The AA phase will conclude with the selection of a preferred alternative.
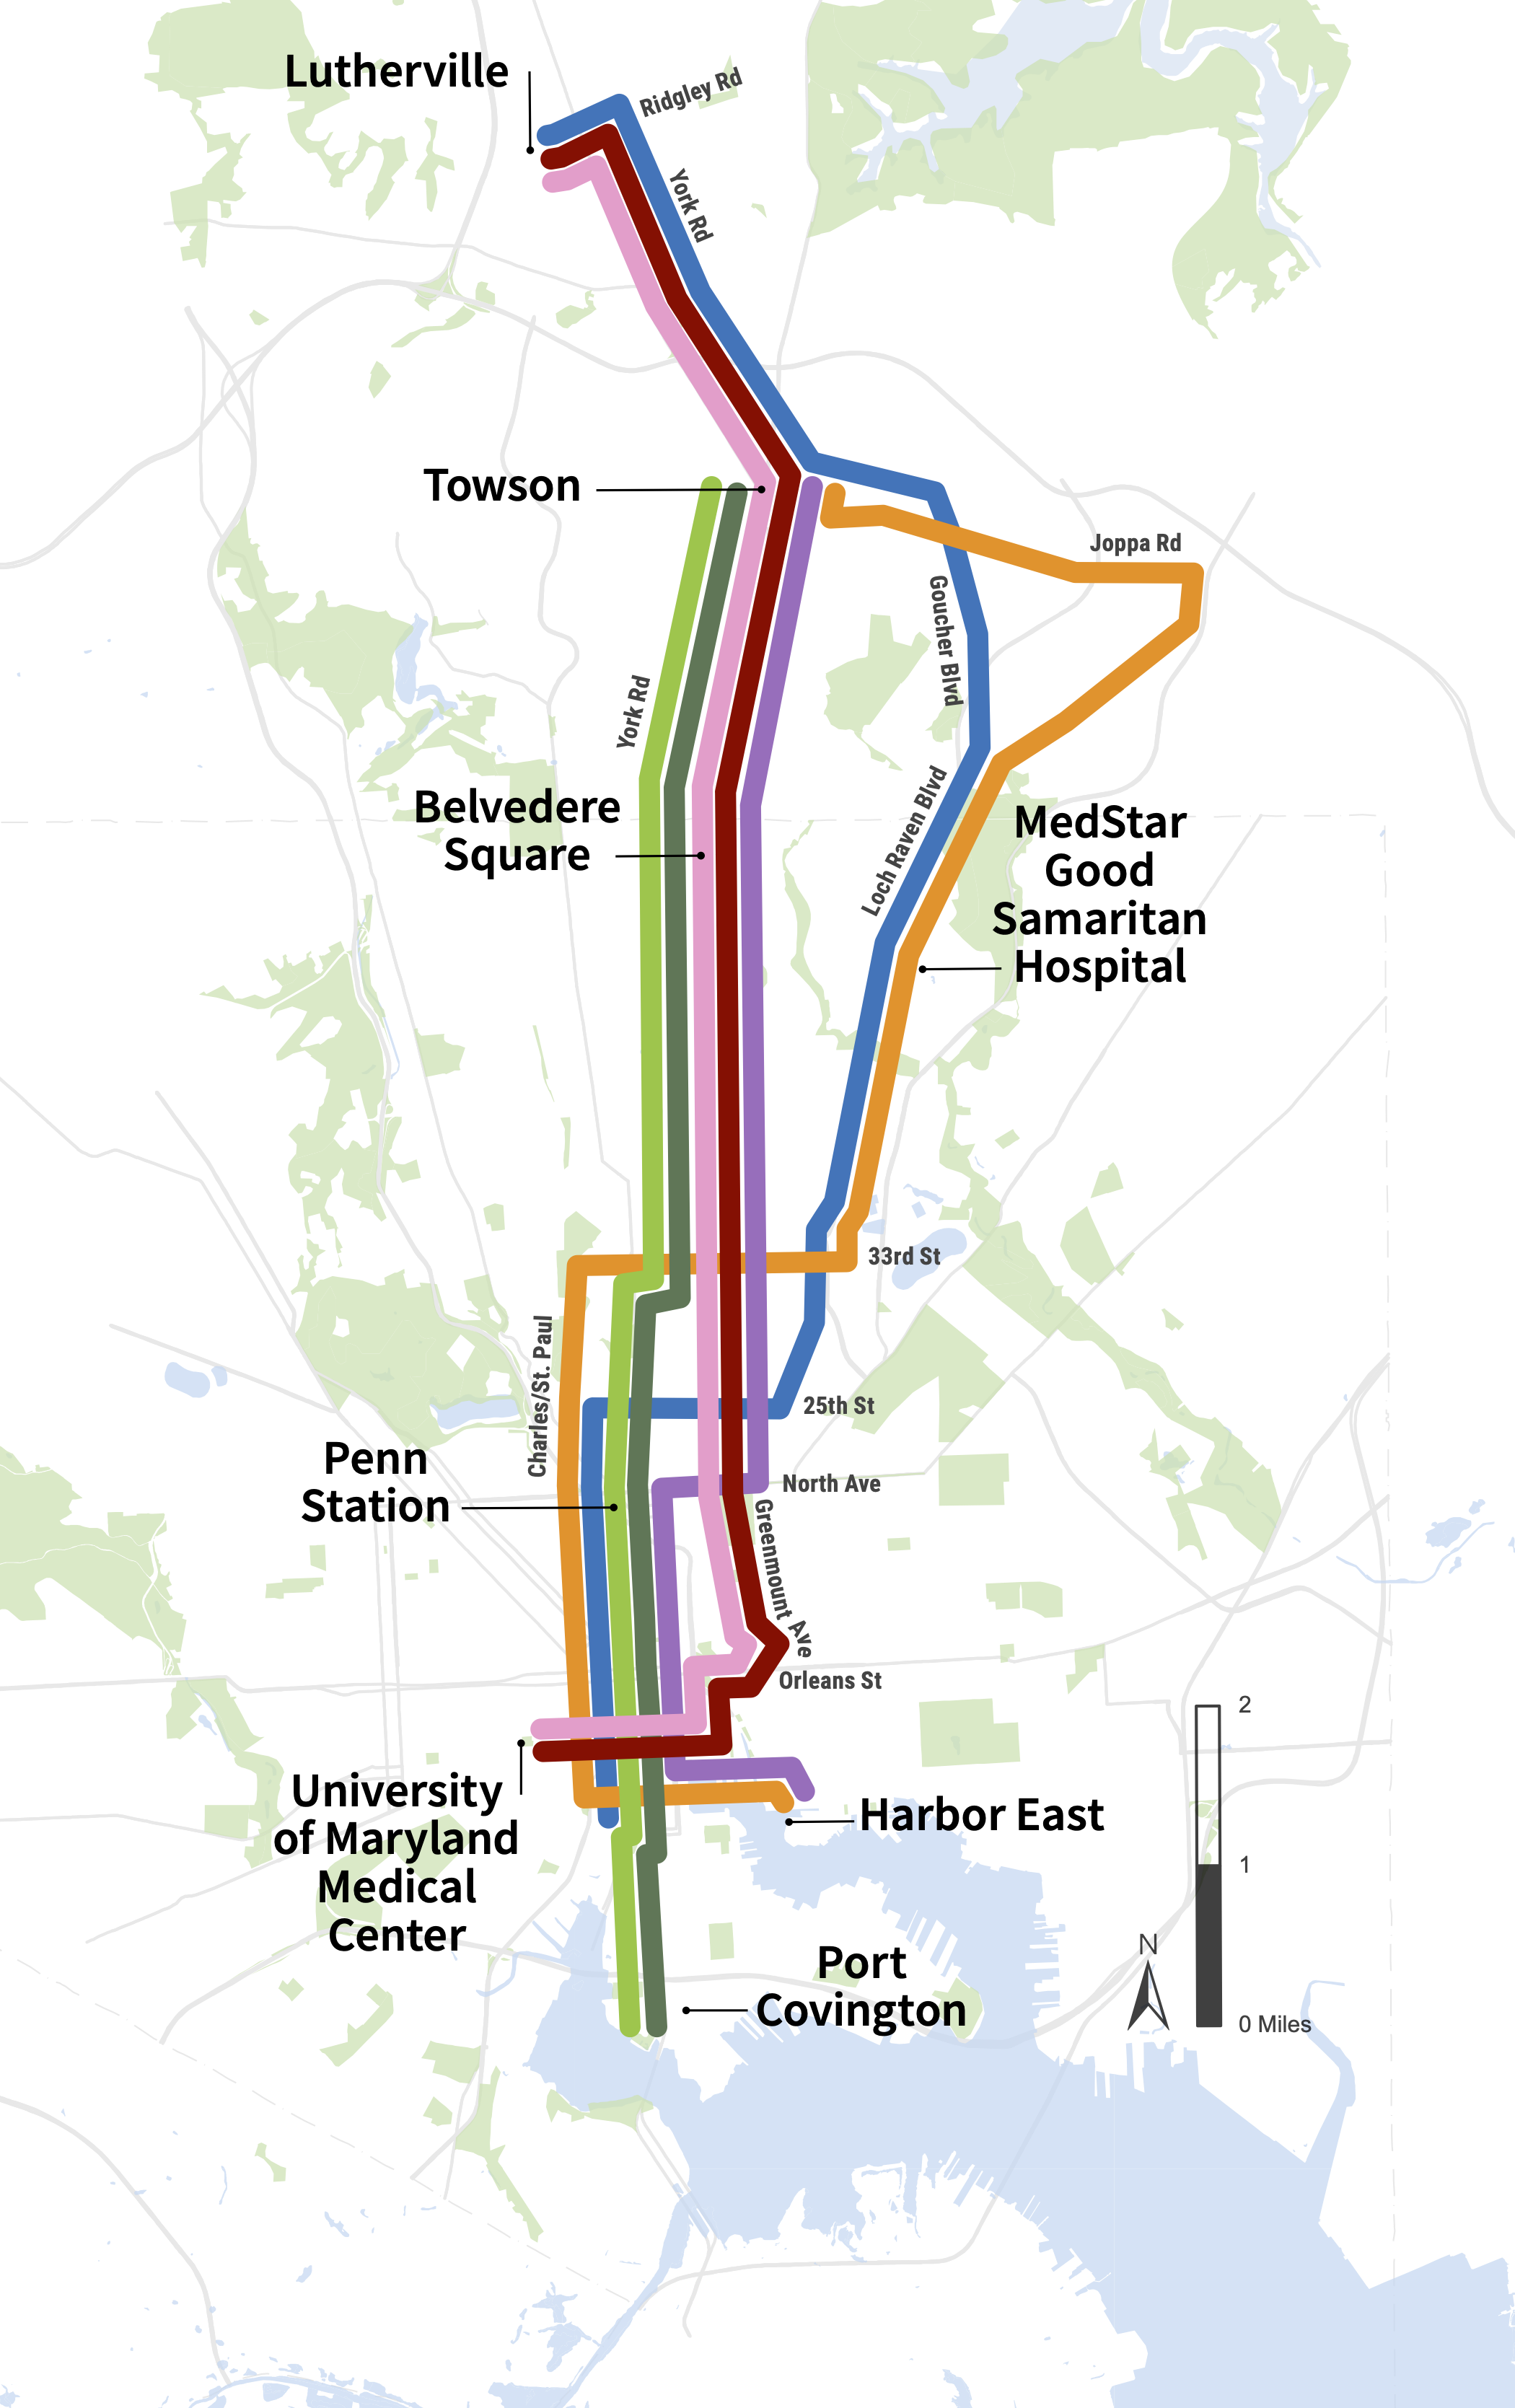
ALTERNATIVES AT A GLANCE
Alternative 1
Light Rail Transit from Lutherville to University of Maryland Medical Center (UMMC) via York Road/Greenmount Avenue.
Alternative 2
Bus Rapid Transit from Lutherville to University of Maryland Medical Center (UMMC) via York Road/Greenmount Avenue.
Alternative 3
Bus Rapid Transit from Towson to Harbor East, via York Road/Greenmount Avenue.
Alternative 4
Heavy Rail Transit (Subway) from Towson to Port Covington, via York Road/Greenmount Avenue.
Alternative 5
Bus Rapid Transit from Towson to Port Covington, via York Road/Greenmount Avenue.
Alternative 6
Light Rail Transit from Lutherville to Otterbein, via Goucher Boulevard, Loch Raven Boulevard.
Alternative 7
Bus Rapid Transit from Towson to Harbor East, via Joppa Road, Loch Raven Boulevard.
HOW WE GOT HERE
DETERMINED PROJECT GOALS
In Spring / Summer 2021, we developed a set of corridor-specific goals and objectives based on input from local jurisdictions and members of the public through conversations and surveys. We used these goals and objectives to evaluate potential routes, modes, and service characteristics (including station locations and frequency). Project goals were to:
 Increase mobility and access to jobs, services, and other opportunities in the region.
 Create strategic connection to multi-modal transportation options locally and regionally.
 Center equity as a core consideration.
 Support the region's economic competitiveness and strategic growth.
CREATED ALTERNATIVES
Alternatives allow us to test combinations of different kinds of transit service (mode) and connections to key destinations (alignments).
Alignment
Mode


|
Heavy Rail Transit (HRT) |
- Electric rail system powered by third rail
- Must operate in exclusive fixed guideway, often underground
- Serves areas with high-density development and high-transit demand
- High construction costs

High

1 - 2 miles

70 - 190
|
Light Rail Transit (LRT) |
- Electric rail system powered by overhead wires
- Operates in dedicated fixed guideway, but can run in mixed traffic
- Medium to high construction costs
High

.5 - 1 mile
60 - 175
|
Bus Rapid Transit (BRT) |
- Bus-based transit system
- Operates in both dedicated busways and mixed traffic allowing for route flexibility
- Provides the quality of rail transit with the flexibility of buses using traffic signal priority, off-board fare collection, elevated platforms and enhanced stations
- Low to medium construction costs

Medium to High

.25 - 1 mile

40 - 110
All Alternatives would operate at 10-15 minute frequencies 20-24 hours per day
SELECTED MEASURES OF EFFECTIVENESS
In Fall 2021, we chose a range of measures that align with the corridor goals to evaluate how each alternative performs. Additionally, we performed modeling to project the ridership and transit system effect each alternative would have. Here is a summary of what we've learned:
|
ALTERNATIVES |
1 |
2 |
3 |
4 |
5 |
6 |
7 |
||
|
|
|
Mode |
LRT |
BRT |
BRT |
HRT |
BRT |
LRT |
BRT |
|
|
|
Endpoints |
Lutherville - UMMC |
Lutherville - UMMC |
Towson - Harbor East |
Towson - Port Covington |
Towson - Port Covington |
Lutherville - Otterbein |
Towson - Harbor East |
|
|
|
Length |
11.6 |
11.5 |
9.2 |
10.5 |
10.4 |
12.5 |
12.6 |
|
|
|
Number of Stations |
21 |
33 |
28 |
9 |
30 |
25 |
32 |
|
|
|
Average Station Spacing (miles) |
0.6 |
0.3 |
0.3 |
1.2 |
0.3 |
0.5 |
0.4 |
|
Goal |
Theme |
Measure of Effectiveness |
Comparison |
Comparison |
Comparison |
Comparison |
Comparison |
Comparison |
Comparison |
|
Increase mobility and access to jobs, services, and other opportunities in the region |
Reliability |
Percent of dedicated or separated guideway |
GOOD |
BETTER |
BETTER |
BEST |
BETTER |
BETTER |
BEST |
|
Fixed or Flexible Guideway |
FIXED |
FLEXIBLE |
FLEXIBLE |
FIXED |
FLEXIBLE |
FIXED |
FLEXIBLE |
||
|
Travel Time Savings |
Transit travel time savings between Towson and Downtown Baltimore (minutes) |
BEST |
BETTER |
BETTER |
BEST |
BETTER |
GOOD |
GOOD |
|
|
Access |
Households within 1/2 mile of a station, per mile |
BETTER |
BETTER |
BEST |
GOOD |
BEST |
BETTER |
BETTER |
|
|
Student population within 1/2 mile of a station per mile |
BETTER |
BETTER |
BEST |
GOOD |
BEST |
GOOD |
BETTER |
||
|
Future jobs within 1/2 mile of a station per mile |
BETTER |
BEST |
BEST |
GOOD |
BETTER |
BETTER |
BETTER |
||
|
Create strategic connection to multi-modal transportation options locally and regionally |
Connections |
Connections to rail stations, frequent bus routes, and locally operated transit routes |
BETTER |
BEST |
BETTER |
GOOD |
GOOD |
BETTER |
GOOD |
|
Additional future jobs accessible by transit within 45 minutes |
BEST |
BETTER |
BETTER |
GOOD |
GOOD |
GOOD |
BETTER |
||
|
Center equity as a core consideration |
Equity 1 |
All transit-critical populations within 1/2 mile of a station, per mile |
BETTER |
BETTER |
BEST |
GOOD |
BETTER |
BETTER |
BETTER |
|
Support the region's economic competitiveness and strategic growth |
Cost |
Capital cost |
$$$ |
$ |
$ |
$$$ |
$ |
$$ |
$ |
|
Development Opportunity |
Transit-Oriented Development and Opportunity Zones within 1/2 mile of station |
BETTER |
GOOD |
GOOD |
GOOD |
BEST |
BETTER |
BETTER |
|
|
Implementation |
Implementation time |
MIDDLE |
SHORTEST |
SHORTEST |
LONGEST |
SHORTEST |
MIDDLE |
SHORTEST |
|
|
Bridge and Tunnel Complexity |
MEDIUM |
N/A |
N/A |
HIGH |
N/A |
MEDIUM |
N/A |
||
|
Support the regions sustainability goals. |
Ridership |
Projected daily boardings in 2045, per mile |
BETTER |
BETTER |
BEST |
GOOD |
BEST |
BETTER |
BETTER |
|
Sustainability |
Zero-car households within ½ mile of a station, per mile |
BETTER |
BETTER |
BETTER |
GOOD |
BETTER |
BETTER |
BEST |
|
1 Sum of low-income, minority, limited English proficiency, and 65+ populations, people with disabilities, and zero-car households within 1/2 mile of a station, per mile. People/households may be counted more than once if they're part of multiple transit-critical groups.
STAY ENGAGED
In addition to the website, you can share your thoughts:
NEXT STEPS

Identify Alternatives for Further Study
MDOT and local jurisdictions will use public feedback to compare options and develop alternatives for further study in the next phase of this project.

Additional Analysis
The alternatives in the next study will receive additional engineering and environmental analysis and public input to narrow down to a single option.

Apply for Funding
MDOT MTA and its partners will develop a local funding plan and apply for funding to support design and construction once a preferred option has been confirmed.
![]()